


Data. Automation. Impact.
We transform complex data and inefficient processes into intuitive dashboards and automated workflows—helping mission-driven organizations achieve greater impact.
Services

Empower Decisions with Dashboards
Transform spreadsheets into dynamic, interactive dashboards that drive meaningful action.
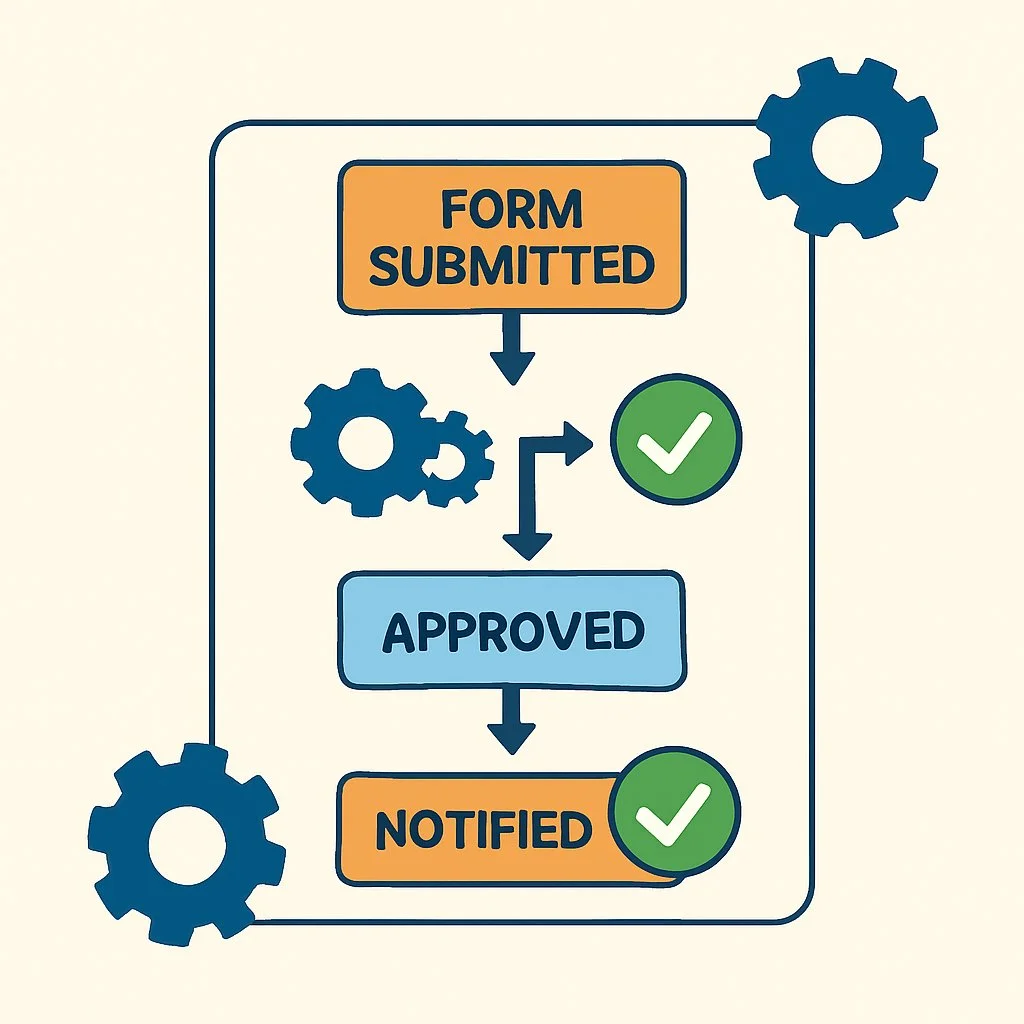
Reclaim time. Eliminate bottlenecks. Simplify operations.
From onboarding forms to funding workflows, we automate repetitive tasks with tools your team already uses. That means less stress, fewer errors, and more time to focus on the mission.

Insightful research to support funding, programs, and strategic growth.
We design and analyze community surveys, stakeholder feedback, and local trends to uncover what really matters. Our reports help you secure grants, impress funders, and make smarter decisions.
Who We Are
SierraView Insights partners with mission-driven organizations to make sense of complex data, streamline workflows and improve decision-making. Our analysts and engineers build intuitive dashboards, automate tedious tasks, and conduct insightful research—so you can focus on your mission and maximize impact.

Schedule Your Free Consultation
Discover how SierraView Insights can streamline your reporting, automate workflows and turn your data into actionable insights. Schedule a free consultation with one of our experts.
